What would a world without aircraft look like? Obviously there would be a big impact on the economy and global travel would take a lot longer (perhaps with a return of ocean liners). There would also be a climate effect, as aircraft burn fossil fuels and create greenhouse gases. They also create clouds, known as contrails.
Contrails are thin, wispy clouds that spread out to cover the sky under the right weather conditions. New contrails are easy to spot as they have a distinctive, straight-line shape, but older contrails can look like natural clouds. This makes it difficult to work out the amount of high clouds that are actually generated by aircraft.
The reduction in air traffic in response to the COVID-19 pandemic provided a way to do this. With many fewer aircraft flying, it gives us a window into a world without any aircraft, allowing us to estimate the climate impact of aircraft changing clouds.
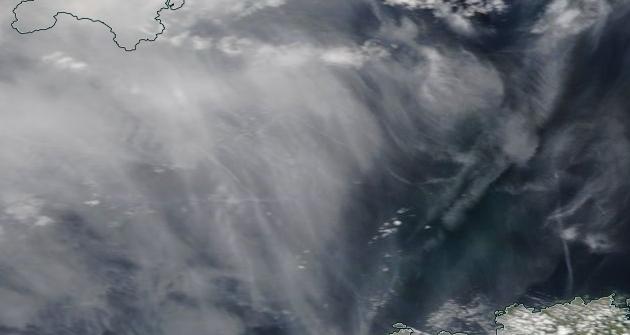
Thin cirrus over the English Channel. The lines in the image are fresh contrails, but how different would the cirrus cloud be without aircraft?
How do contrails form?
Condensation trails (contrails) were first observed behind aircraft during World War 1 [1] and have become a more common feature of our lives as air travel has increased.
When aircraft burn fuel, they create heat and water. When this hot, moist air from the aircraft exhaust mixes with the cooler, drier air found at high altitudes, the humidity increases. If the conditions are right, the relative humidity can increase enough to form a cloud. This is the linear contrail that you can observe directly behind an aeroplane.
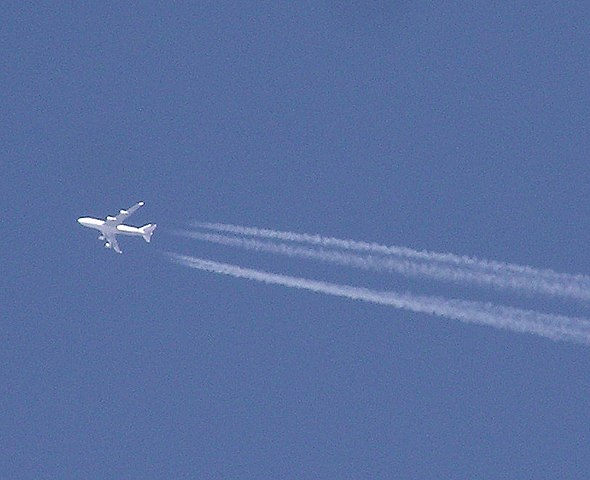
Contrails forming immediately behind an aeroplane (Wikimedia user Arpingstone)
If you know the temperature and humidity of the engine exhaust, the Schmidt-Appleman criterion [2] determine whether a contrail will form. However, determining the lifetime, coverage and eventual climate effect of contrails is much harder [3].
Visible and invisible effects of clouds
All clouds have warming and cooling effects on the climate, but the balance between these effects varies. Remember our criteria for a cloud.
- Clouds are wet
- Clouds are white
- Clouds are cold
2 and 3 are most important for the climate effect. All clouds are white and reflect light back into space - a cooling effect. Thicker clouds reflect more light so have a stronger cooling effect. This is the visible effect of clouds.
Clouds also have an invisible effect. Clouds are cold, which means they emit less energy as infra-red than the surface (which is usually much warmer). By trapping this invisible infra-red radiation, clouds have a warming effect on the climate. The colder the clouds are compared to the surface, the stronger the warming effect.
Contrails are thin (so have a weak cooling effect), but also very high and cold (so a strong warming effect). This makes them almost perfectly designed to warm the Earth. Knowing lifetime of contrails and the area they cover is critical to work out the impact of aircraft on the climate.
How long do contrails last?
Contrails form through the mixing of exhaust and environmental air. Usually, as more environmental air is mixed into the contrail, it will eventually evaporate again within a few minutes. This is not always the case though, some regions in the upper troposphere (the part of the atmosphere where aircraft fly) have humidity high enough for a cloud to grow, but one has not already formed. When contrails form here, they don't evaporate, but grow instead!
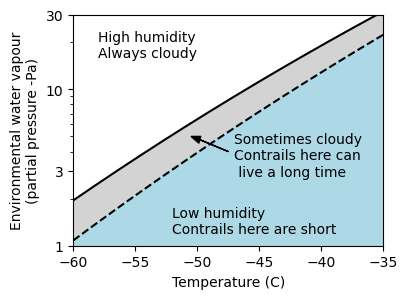
Some contrails evaporate quickly, others can live for a long time, depending on the environmental conditions. More details on this plot in the notes [4]
You can think about the atmosphere in the grey region as waiting to form a cloud, it just needs to be triggered (by an aeroplane) into doing it. When contrails form in these 'cloud-ready' regions, the resulting cloud can eventually spread out to cover the sky lasting for many hours. These long-lived contrails are the ones that have a really large impact on the climate.
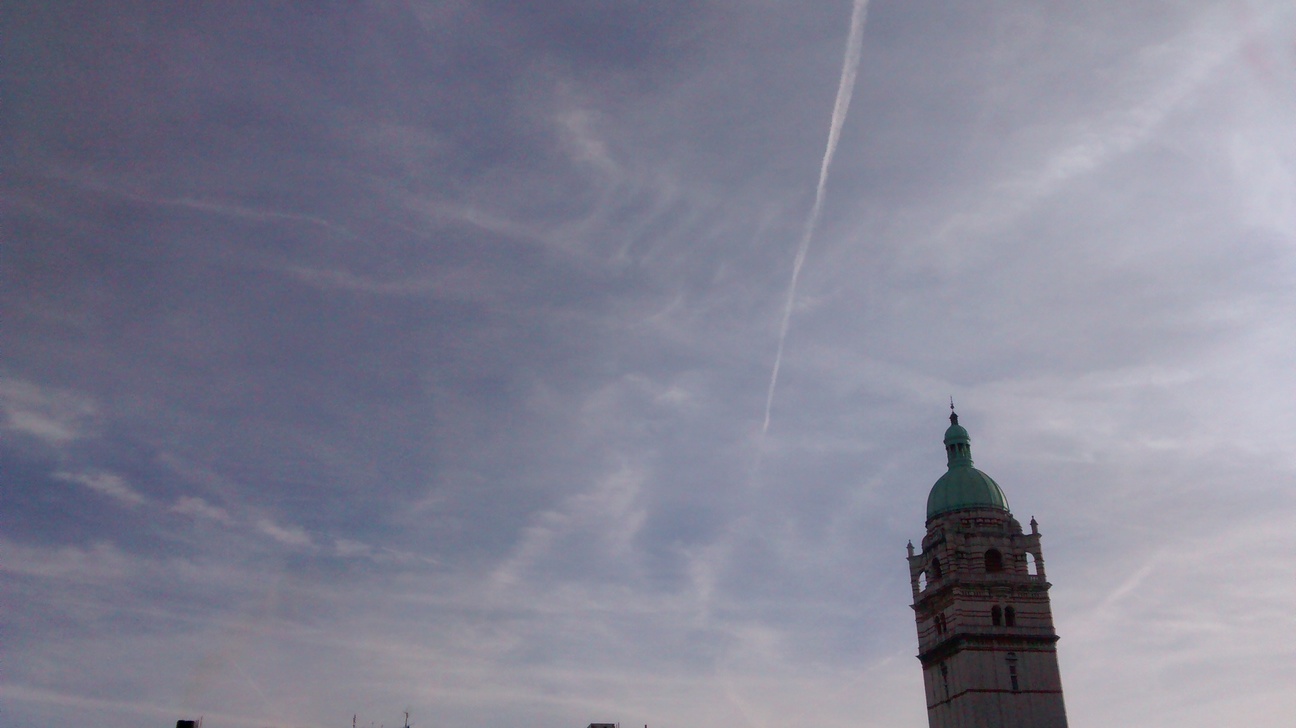
Thin cirrus cloud above Imperial College. These are long-lived contrails, but if you didn't know they were initially triggered by aircraft, could you tell?
Unfortunately, these long lived contrails look really like naturally formed cirrus clouds, so working out the total coverage of contrails is really difficult [5]. One way is to use a climate model that simulates contrails, but you can only simulate simplified versions of contrails [6]. If we want to use observations to measure the effect of aircraft on clouds, we need an experiment where aircraft are forced to stop flying for a while...
COVID-19 and aviation
From mid-March 2020, multiple countries closed their borders or severely restricted international travel in an attempt to slow the spread of COVID-19. This led to a large decrease in passenger numbers and an almost 70% reduction in flights in 2020 compared to 2019. A perfect opportunity to study the climate impact of aircraft and how they change clouds!
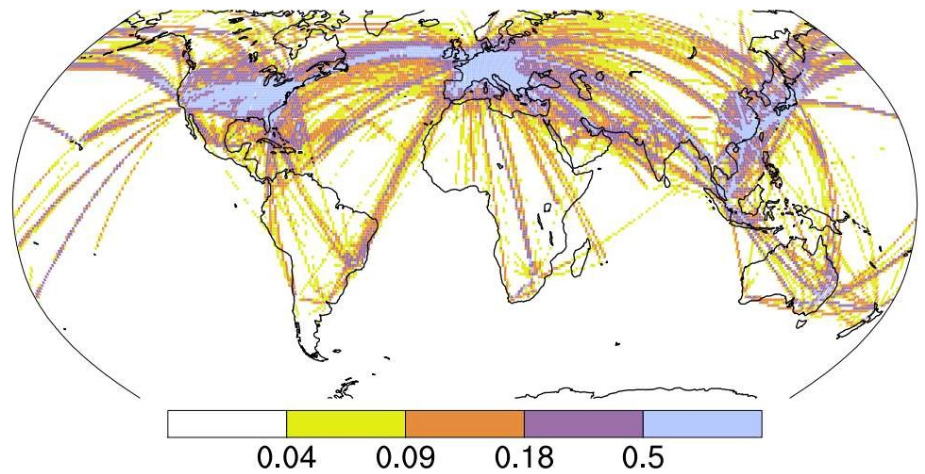
Map of the change in flight density due to the COVID-19 shutdown. Blue regions usually have the highest desity of flights, and also the largest decrease due to the shutdown. Notice the large decrease over Europe and the USA. Image from Quaas et al., ERL, 2021.
In this study, led by Johannes Quaas at the University of Leipzig together with Olivier Boucher and Robert Vautard at IPSL, we used satellites to measure how the amount of high, thin clouds changed in 2020.
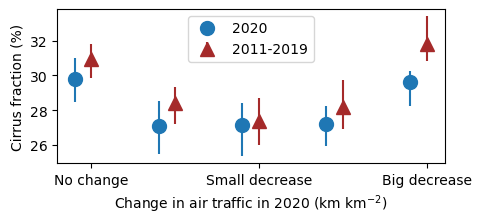
The change in cirrus fraction (average amount of sky covered by cirrus cloud) in 2020 (blue) compared to the average from 2011-2019, for five different levels of change in flight distance. Regions with larger changes in aircraft activity during the shutdown are on the right. Image adapted from Quaas et al., ERL, 2021.
There was less cirrus in 2020 than you would expect, based on the average for 2011-2019. The biggest change was in regions where there was a large decrease in the distance flow by aircraft. Problem solved?
Not quite. There is also less cirrus in 2020 for regions that had almost no change in air traffic (on the left of the plot). What is going on, how can there be a change here - there was no change in air traffic!?
Changing weather
Clouds change with the weather - changes in weather can also impact how likely clouds are to form. In March/April 2020, Europe was covered by a (record breaking) high-pressure system that kept the skies clear for weeks. Was the decrease in high, thin cloud in 2020 just due to changes in the weather?
The weather situation on the 8th of April 2020. High pressure systems (where there is an 'H') usually have little cloud. Did that change the amount of cirrus? Image courtesy UK Met Office, contains public sector information licensed under the Open Government Licence.
To get a better idea of the contrails that would have formed in 2020 had aircraft still been flying, this paper uses 'circulation analogues'. Each day in 2020 is matched to days with similar weather patterns in the 2011-2019 period. The average cirrus cloudiness from these 'matched' days then gives an estimate of how cloudy 2020 would have been if aircraft were still flying, as you can see with the orange dots here.

'Analogues' to the 2020 weather in orange and the actual 2020 cirrus fraction in blue. These provide a better measure of the cirrus cloud expected in 2020 than the average of 2011-2019. Image adapted from Quaas et al., ERL, 2021.
The result is pretty spectacular! If only days from 2011-2019 that match the weather situation in 2020 are looked at, the amount of cirrus in 2020 is almost exactly the same as expected in regions where there is no change in aircraft (on the left). However, in regions where there was a large decrease in aircraft, there was an even larger decrease in cirrus than first expected!
A world without aircraft
Matching the weather patterns in 2020 to previous years means that we can now use the cirrus change in 2020 as a pretty good estimate of the actual aircraft impact on thin high clouds! In the regions where there was the biggest change in air traffic in 2020, there was almost 10% less cirrus than we would have expected.
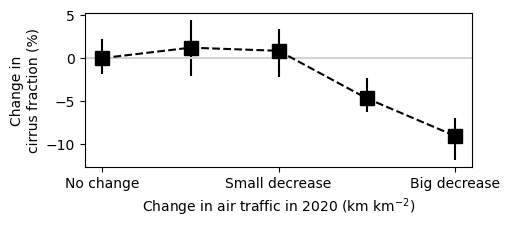
In regions where there was the largest change in air traffic, there was an almost 10% decrease in the cirrus fraction in 2020.
This change in cirrus can then be used to think about what the world would look like without airplanes. How would the climate be different?
The effect of human activities on climate is often measured by 'radiative forcing' - how much the flow of energy into/out of the Earth system changes. Greenhouse gases have a positive radiative forcing (a warming of about 3 Wm-2). Using the COVID-19 shutdown to measure the amount of contrail cirrus, we estimate that the warming from contrails is about 0.061 Wm-2 (about 2% of the total).
This looks small, but it is already much larger than the warming from the CO2 emitted by aircraft, more than doubling the climate impact of aircraft [7]. There is an important difference with contrails though, when compared to greenhouse gases - contrails have a much shorter lifetime.
If you stopped flying aircraft today, the warming from contrails would disappear within a few days. The greenhouse gas effect would continue for hundreds of years. Minimising the warming from contrails would be an important short-term win, but we ultimately still have to move away from fossil fuels if we want to limit the damage caused by climate change.
For more information, please see Climate impact of aircraft-induced cirrus assessed from satellite observations before and during COVID-19 by Quaas et al, Env. Res. Lett. (2021).
Notes
| [1] | The first observation of contrails is probably lost to time, but this mention in Scientific American in 1919 seems to be one of the earliest written accounts (Clouds formed by Airplanes - reported by Ernest Well). Some further early observations of contrails are covered here |
| [2] | See On conditions for contrail formation from aircraft exhausts by Schumann for a really great review of the early studies on contrails |
| [3] | This paper by Kärcher is a good summary of the current understanding of contrail cirrus and its climate effect. |
| [4] | The high humidity region rarely occurs in practice, as water vapour will condense onto available surfaces at very high humidity, reducing the humidity (moving downwards in the plot) until you reach the solid black line. Here, any remaining liquid water freezes and the humidity decreases further until you get to the dashed line. In this case, they grey region is cloudy. However, if you didn't start in the high humidity region and there is not already something for the water vapour to condense onto (there is no cloud already), the grey region can be cloud free. This is despite there being enough water to form a cloud. If you form a contrail under these conditions, it can persist for a long time. |
| [5] | There is an additional difficulty. Aircraft are not the only things that can trigger cloud formation in ISSRs. Waves from mountains and distant storms, as well as general cooling can also form clouds. Even if you could track all the long-lived contrail cirrus, that does not necessarily represent the total climate effect, as those cloud might have formed naturally. |
| [6] | Some of the most sophisticated climate models include a separate cloud type for contrails, which means that you can get a clean estimate of their climate effect. Bock and Burkhardt - Contrail cirrus radiative forcing for future air traffic (Atmos. Chem. Phys., 2019) is a good recent paper using this approach. It also has some rather worrying projections for the future climate impacts of aircraft. |
| [7] | Aircraft can have other effects on clouds and climate - Lee et al, The contribution of global aviation to anthropogenic climate forcing for 2000 to 2018 (Atm. Env., 2020), gives a more complete coverage of aviation impacts on the climate. |